Impedance Module
With the Impedance Module for Maestro Pro, Maestro Edge, Maestro Z, and Maestro ZHT you can quickly and easily track cell proliferation, viability, morphology, immune cell-mediated killing, viral cytopathic effect, and more - label free and in real time in every well of a multiwell plate.
Powerful data doesn’t have to mean complicated software. The Impedance Module includes AxIS Z software, providing a straightforward, simplified approach to the set-up, execution and analysis of impedance experiments.
Key Features
Impedance Module overview
The Impedance Module with AxIS Z makes impedance-based assays easy. Take control of experimental settings, view real-time cellular profiles, extract straightforward endpoints, or perform in-depth analysis of cytolysis or barrier function with ease.
Assay setup
- >> Assay setup is a breeze with automatic acquisition and pre-configured settings for analysis while allowing fast access to advanced settings as experimental needs require.
- >> Easily referenced color-coded plate map provides all the information about your experiment in real time and tracks control types for analysis automation.
Real-time visualization
- >> Continuous impedance data is displayed for each treatment group across the plate in real time. Drag the cursor to see a comparison across treatment groups at any time, along with a plate-wide impedance map which gives a broader comparison of effects across the plate. Add time-stamped notes to indicate important events, such as dosing, and later for normalization or correction with a single click.
- >> Monitor your active experiments from outside the lab with the new Maestro Z App. Use the app to check in on your cells and experiment to ensure everything is running smoothly while you are away.
Data analysis tools
- >> With the click of a button, plot percent cytolysis curves and see 50% killing time (KT50) values.
- >> With AxIS Z’s curve fitting tools, perform dose response analysis quickly and easily, computing EC50/IC50 automatically.
- >> AxIS Z’s Barrier Index lets you easily investigate permeability through cell membranes.
- >> Generate publication-ready figures with AxIS Z’s interactive report, called the Lab Notebook, which allows you to export figures and data tables directly to Microsoft Excel®. The Lab Notebook contains fully customizable figures with live data references and error bars.
Overview
Kinetic label-free data
Cell-based assays enable rapid evaluation of human biology in vitro, with substantial advantages in throughput and cost over tissue or animal models. However, many cell-based assays are endpoint assays limited to a single snapshot in time. With the Impedance Module for Maestro Pro, Maestro Edge, Maestro ZHT, and Maestro Z, continuously monitor cells in real time, label free, with impedance-based cell analysis. Continuous data reveals the kinetics of cell interactions and cell-drug responses for a more complete dataset without the time- and cost-intensive process of repeating multiple endpoint assays.
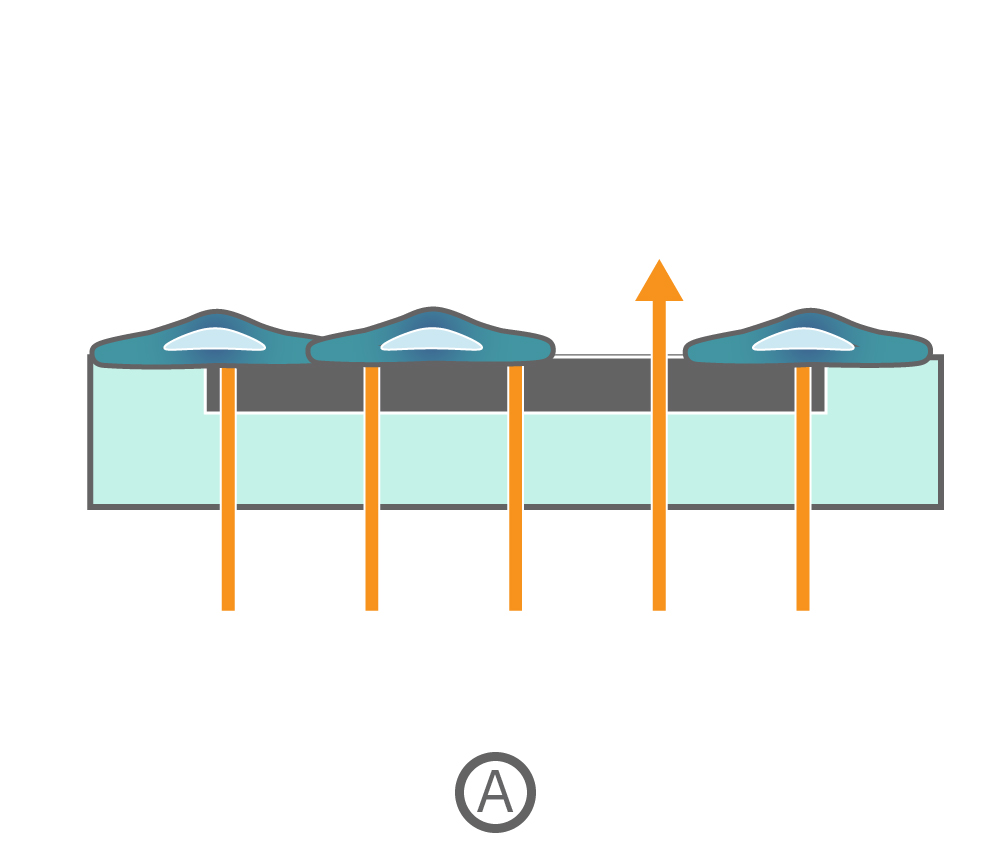
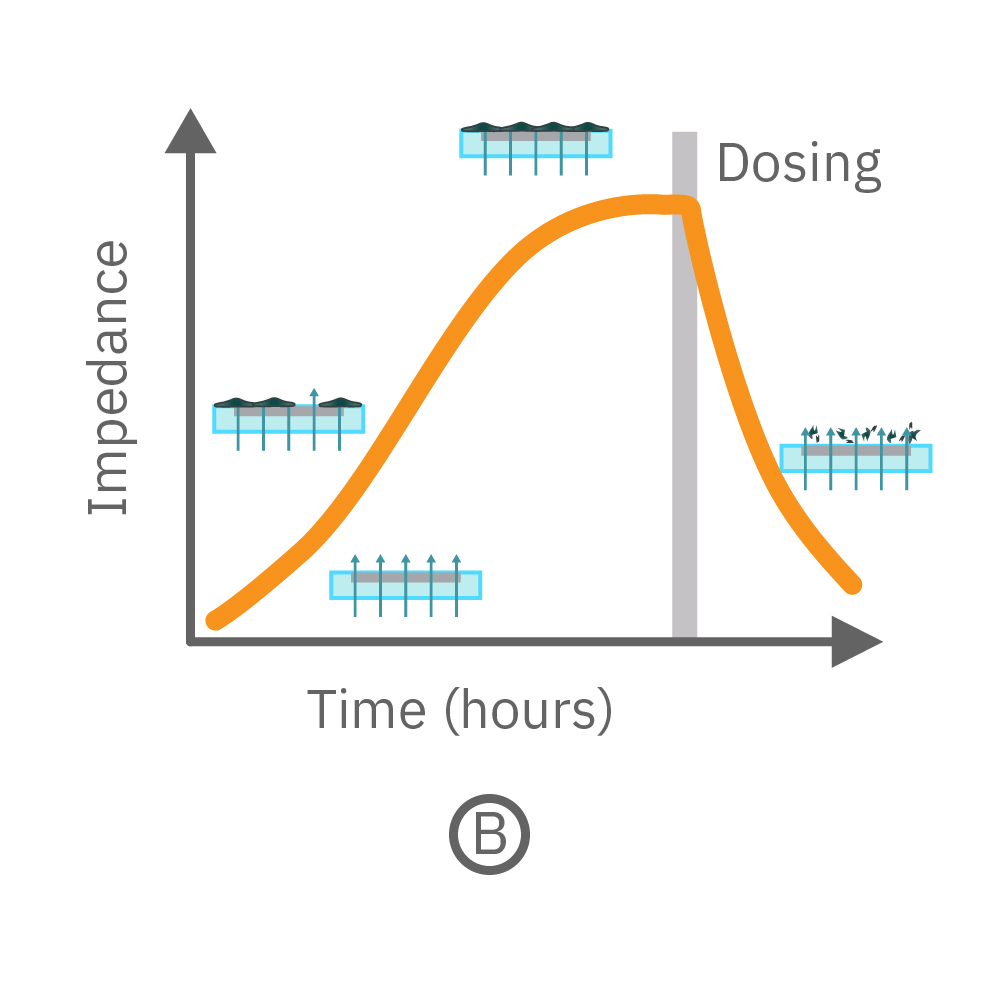
Cells can be cultured in Axion's CytoView-Z plates on recording electrodes embedded in the culture surface of each well. The Impedance Module measures impedance (ohms, Ω) to quantify the presence of cells on the electrode. To measure impedance, small electrical signals are delivered to the electrodes, and the ease with which the signal passes through the electrode-cell interface is measured (A, orange-colored arrows). When the electrode is uncovered, electrical signal easily passes (thick arrows) and the impedance is low. When cells cover the electrode, less electrical signal passes (blocked arrows) and impedance is high. When cells die or detach, the impedance decreases back towards baseline (B).


Cell attachment, spreading, and cell-cell connections block the electrical signals and are detected as an increase in impedance. Impedance is also sensitive to subtle changes in cell conformation, such as those caused by receptor-mediated signaling or cell morphology. Since impedance is noninvasive and label free, impedance assays can be used to quantify dynamic cellular responses over minutes, hours, and days.