Key Findings
>> Effects of doxorubicin on C6 spheroids can be evaluated with brightfield and fluorescence imaging using the Omni platform.
>> C6 spheroid formation occurs in a two-phase process, aggregation, and growth.
>> Doxorubicin has a dose-dependent effect on C6 spheroids.
Abstract
Three-dimensional (3D) cell cultures such as spheroids and organoids serve as a representative model for tumors and the interaction with the microenvironment. Here, the Omni live-cell imaging platform was used to monitor and analyze spheroid formation for multiple cell types. Additionally, the uptake and effect of the chemotherapy drug doxorubicin on spheroids were monitored on the Omni, demonstrating its use as a valuable tool for evaluating drug impact on 3D models.
Introduction
Cancer accounts for a significant number of deaths worldwide and continues to be the second leading cause of mortality1. The invasiveness of the type of cancer plays a major role in determining treatment options and survival. Highly invasive, difficult-to-treat cancer types include glioblastoma and other high-grade malignant brain tumors, non-small cell lung cancer, and triple-negative breast cancer2. These tumors are characterized by genetic mutations in oncogenes and tumor suppressor genes. In combination with their highly invasive nature, these mutations pose significant challenges for effective treatment3-5.
Traditionally, two-dimensional (2D) monolayer cell cultures have been used to investigate the antitumor activity of a therapeutic compound. Those culture methods are relatively straightforward, cost-effective, and ideal for high-throughput screening using well-established assays. However, monolayer cultures present a simplified version of tumors that may insufficiently capture essential cellular organization and interactions found in vivo6,7. To overcome these limitations, three-dimensional (3D) cell culture models such as spheroids and organoids are increasingly developed in research. 3D cultures have emerged as powerful tools in tumor research, primarily due to their ability to better mimic the natural microenvironment8,9. Spheroids, which are self-assembled cell aggregates, exhibit more complex cell-cell interactions as well as a nutrient and oxygen gradient, making them promising models for drug treatment and drug development studies, especially in oncology research10,11.
Despite their advantages over 2D cultures, 3D models also have limitations, including higher cost and variability in spheroid formation efficiency. These challenges highlight the necessity to optimize culture methods. Additionally, assays traditional designed for 2D setups may pose challenges when adapted to suit the complexities of 3D cultures12,13. Live-cell imaging presents a valuable tool in oncology research using spheroids, as it enables continuous monitoring of spheroid development in size and morphology. This method will facilitate evaluation of various culture methods and supports drug treatment analysis by providing kinetic data on drug uptake and cytotoxicity.
In this study, the Omni live-cell imaging platform was used to monitor the effect of doxorubicin (DOX) on cancer spheroids to demonstrate the benefits of live-cell imaging in analyzing drug studies with 3D cell culture models. First, formation and growth of various cancer spheroids was characterized. C6 cells (rat glial cells), A549 cells (adenocarcinomic human alveolar basal epithelial cells), and MDA-MB-231 cells (human epithelial mammary adenocarcinoma cells) were used as they serve as a valuable model for glioblastoma, lung cancer, and triple negative breast cancer, respectively14-16. DOX, an anthracycline drug, is widely used as an antitumor agent in the treatment of various types of cancer, including breast, lung, ovarian, and brain tumors17. Therefore, after the characterization of spheroid formation, C6 spheroids were exposed to various concentrations of DOX to assess its effect on their growth.
Materials and Methods
Cells and reagents
C6 cells (ATCC, Cat. CCL-107) were maintained in DMEM medium (Gibco, Cat. 41965039) supplemented with 10% fetal bovine serum (FBS; Gibco, Cat. 16000044) and 1% penicillin/streptomycin (Gibco, Cat. 15140122). A549 cells (Innoprot, Cat. P20118) were maintained in Ham’s F-12K medium (Gibco, Cat. 21127022) supplemented with 10% FBS (Gibco, Cat. 16000044) and 250 µg/mL G418 (Gibco, Cat. 10131035). MDA-MB-231 cells (Innoprot, Cat. P20317) were maintained in RPMI medium (Gibco, Cat. 11875093), 10% FBS (Gibco, Cat. 16000044), 1% penicillin/streptomycin (Gibco, Cat. 15140122) and 10 µg/mL puromycin dihydrochloride (Gibco, Cat. A1113803). Cells were passaged every 3 days when confluence reached 80%.
Cancer spheroid formation
First, a 96-well U-bottom plate (VWR, Cat. 734- 2782) was prepared by adding 100 µL AntiAdherence Rinsing Solution (STEMCELL Technologies, Cat. 07010) to each well that was used. The plate was incubated for 5 minutes at room temperature, followed by aspiration of the Anti-Adherence Rinsing Solution. The wells were washed by adding 100 µL PBS, incubating for 5 minutes, and aspirating the PBS.
C6 cells, A549 cells, and MDA-MB-231 cells were lifted from flasks and dissociated via trypsinization and subsequently counted using the Exact FL. Next, the cells were centrifuged and resuspended in appropriate medium to the desired working concentrations. Cells were introduced to the pre-treated U-bottom plate by adding 100 µL of cell suspension per well, resulting in the respective final cell densities of 1,000, 1,250, 2,500, 5,000, and 10,000 cells per well. The plate was centrifuged at 1000 rpm for 4 minutes. The well plate was placed on the Omni inside an incubator at 37 °C and 5% CO2. Spheroid formation was monitored simultaneously across all cell types over 72 hours using the Omni platform with a time interval of 3 hours. During brightfield acquisition, the camera scans the sample stage while acquiring a series of sequential images that are stitched together to create a total surface area image. This allows for the assessment of all spheroids simultaneously. Data analysis was performed using the Axion Portal.
Doxorubicin dose-response assay
C6 spheroids were prepared as described before using a final cell density of 2,500 cells per well. DOX (Sigma, CAS-no: 25316-40-9) was diluted to 2x the desired final concentration from the stock solution using the appropriate cell culture medium. After 72 hours of spheroid formation, 100 µL of DOX solution was added to each well containing the spheroid in 100 µL of medium, yielding final concentrations of 0, 5, 10, 20 and 32 µM. The well plate was placed on the Omni inside an incubator at 37 °C and 5% CO2. DOX uptake was monitored over 72 hours by imaging every hour.
As DOX is inherently red fluorescent, an increase in red fluorescence indicates DOX uptake. The size of the spheroid and the red fluorescence object intensity within spheroids were analyzed using the Axion Portal. As the size of the spheroid influences the fluorescence intensity, the object intensity was normalized using the following equation:
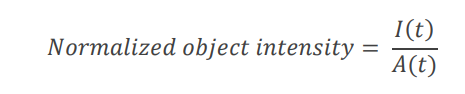
where 𝐼𝐼(𝑡𝑡) represents the intensity at time 𝑡𝑡 and 𝐴𝐴(𝑡𝑡) represents the area at time 𝑡𝑡.
Results
Real-time monitoring of cancer spheroid formation and growth
To investigate the effect of DOX on cancer spheroids, the optimal seeding density and spheroid culture time had to be determined first.
Various seeding densities were investigated for a 72-hours period (Fig. 1). The brightfield images (Fig. 1, top) showed that the different cell types form varying types of spheroids. C6 and A549 cells both form compact spheroids, whereas MDAMB-231 form loose clusters of cells instead of a compact spheroid. The A549 spheroids are more irregularly shaped compared to the C6 spheroids. As C6 cells form the most round and compact spheroids, C6 cells were used for the remaining experiments.
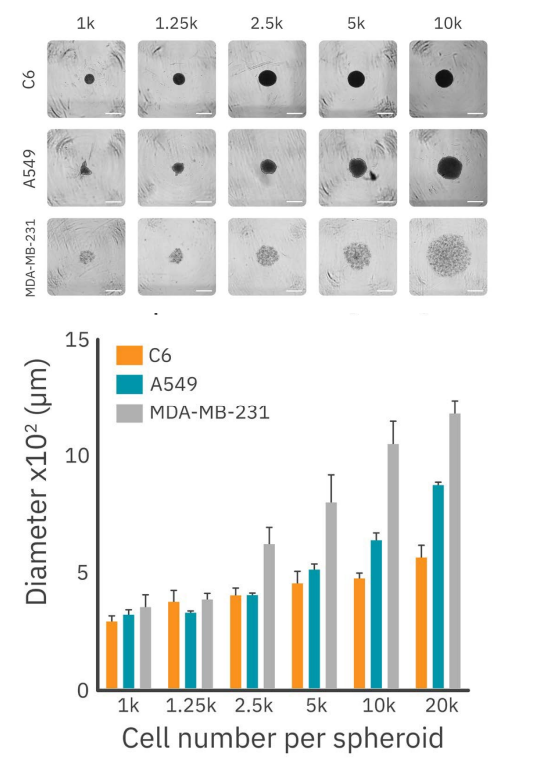
Figure 1 displays the size of the different types of spheroids for the varying seeding densities. According to existing literature, spheroids exceeding 500 µm in diameter tend to develop necrotic regions18. To address this, 2,500 cells per well was chosen as the optimal seeding density. This condition ensures the formation of stable midsized spheroids without necrotic regions and facilitates ongoing growth for the duration of the drug treatment experiments. This seeding density was used to further characterize the growth pattern of C6 spheroids.
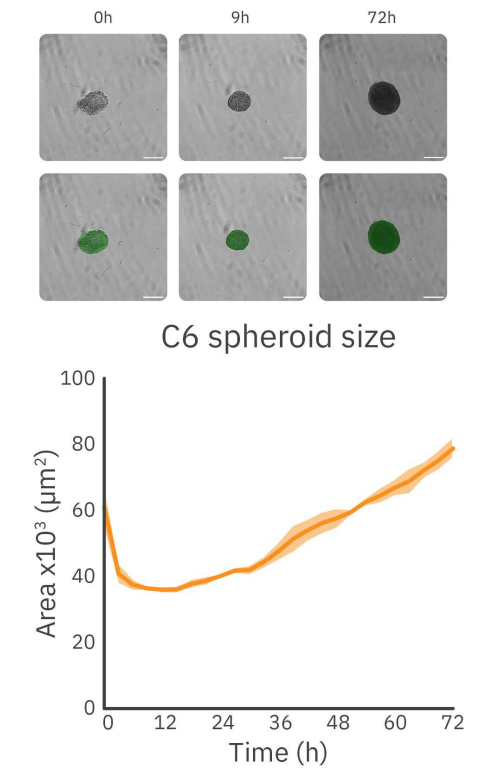
As shown in Figure 2, the formation and growth behavior of C6 spheroids at a seeding density of 2,500 cells per well can be divided into two phases: the formation phase and the growth phase. During the first phase, dispersed cells aggregate to form the spheroid, resulting in an initial decrease in size. The duration of this phase can vary based on cell type and seeding density. For C6 cells with a seeding density of 2,500 cells per well, it takes approximately 9 hours. Following this initial phase, the second phase commenced, during which the spheroids expand.
Doxorubicin inhibits spheroid growth
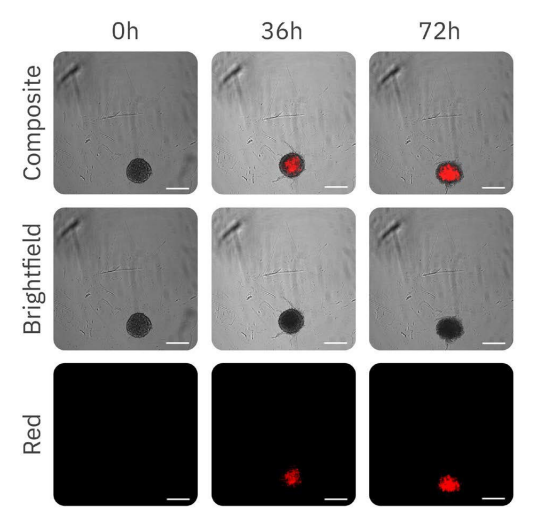
The effect of increasing concentrations of DOX on C6 spheroids is shown in Figure 3. The fluorescence images (Fig. 3) demonstrate the progressive uptake of DOX by the spheroids over time.
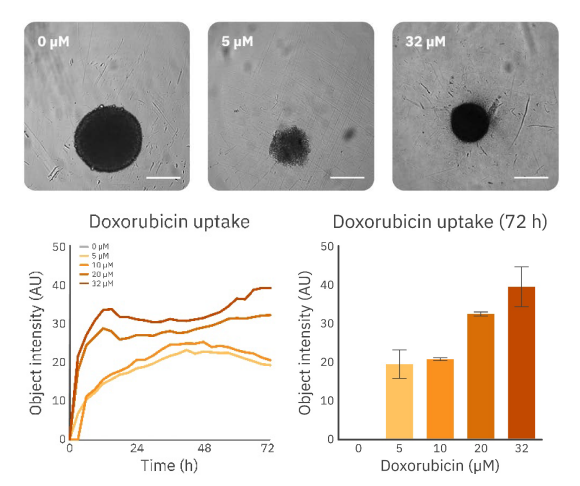
For more insight into the effect of DOX uptake, the object intensity was used to analyze the intensity increase over time (Fig. 4). The expected uptake is confirmed by the analysis of the fluorescence intensity within the spheroid over time. As shown in Figure 4, there was a fast uptake of DOX. Notably, higher concentrations result in a more substantial internalization by the spheroid. Additionally, the uptake pattern significantly varies among the lowest and highest concentrations. Lower concentrations (5 and 10 µM) display a similar and stable increase in intensity until it reaches a maximum after approximately 42 hours. This is followed by a decrease in fluorescence intensity. The uptake pattern of the higher concentrations (20 and 32 µM) is characterized by a fast uptake indicated by the increase in intensity, followed by a weaker and slower increase in fluorescence intensity indicating continuation of the uptake of DOX. This data suggests higher concentrations of DOX have a different effect on spheroids. However, more extensive research is required to confirm this.
Conclusion
This study demonstrates the advantages of using the Omni live-cell imaging platform to track cancer spheroid formation and assess the effect of antitumor compounds on complex 3D cell culture models. We demonstrated a simple, automated approach that can support evaluation of spheroid culture by tracking spheroid size. Furthermore, the Omni allowed for efficient drug response assessment in both brightfield and fluorescence.
References
1. Fujii et al. Cause of death among long-term cancer survivors: the NANDE study. Healthcare 11(6), March 13, (2023).
2. Siegel et al. Cancer Statistics, 2021. CA: A Cancer Journal for Clinician 71, 7-33, (2021).
3. Habashy et al. Challenges in glioblastoma immunotherapy: mechanisms of resistance and therapeutic approached to overcome them. British Journal of Cancer 127, 976-987, (2022).
4. Mogi, A. & Kuwano, H. TP53 mutations in nonsmall cell lung cancer. Journal of Biomedicine and Biotechnology, (2021).
5. Ghosh et al. Triple negative breast cancer and non-small cell lung cancer: Clinical challenges and nano-formulation approaches. Journal of Controlled Release 337, 27-58, September 10, (2021).
6. Kapalczynska, M. et al. 2D and 3D cell cultures – a comparison of different types of cancer cell cultures. Archives of Medical Science 14(4), 910-919, June (2018).
7. Antoni, D. et al. Three-dimensional cell culture: a breakthrough in vivo. International Journal of Molecular Sciences 16(3), 5517-5527, March (2015).
8. Gunti et al. Organoid and Spheroid Tumor Models: Techniques and Applications. Cancers 13(4), 874, Februari (2021).
9. Cacciamali, A., Villa, R. & Dotti, S. 3D Cell cultures: evolution of an ancient tool for new applications. Frontiers in Physiology 13, July (2022).
10. Perche, F. & Torchilin, V. Cancer cell spheroids as a model to evaluate chemotherapy protocols. Cancer Biology & Therapy 13(12), 1205-1213, October (2012).
11. Thoma et al. 3D cell culture systems modeling tumor growth determinants in cancer target discovery. Advanced Drug Delivery Reviews 69-70, 29-41, April (2014).
12. Huang et al. Research progress, challenges, and breakthroughs of organoids as disease models. Frontiers in Cell and Developmental Biology 9, November (2021).
13. Hofer, M. & Lutolf, M. Engineering organoids. Nature Reviews Materials 6, 402-420, (2021).
14. Halas-Wisniewska et al. The effect of low doses of doxorubicin on the rat glioma C6 cells in the context of the proteins involved in intercellular interaction. Acta Histochemica 122, (2020).
15. Townsend et al. Non-small-cell lung cancer cell lines A549 and NCI-H460 express hypoxanthine guanine phosphoribosyltransferase on the plasma membrane. Onco Targets and Therapy 10, 1921-1932, (2017).
16. Simu et al. Insights into the behavior of triple-negative MDA-MB-231 breast carcinoma cells following the treatment with 17βethinylestradiol and levonorgestrel. Molecules 26(9), May, (2021).
17. Zhao, N., Woodle, M. & Mixson, A. Advances in delivery systems for doxorubicin. Journal of Nanomedicine & Nanotechnology 9(5), (2018).
18. Barisam et al. Prediction of necrotic core and hypoxic zone of multicellular spheroids in a microbioreactor with a U-shaped barrier. Micromachines 9(3), March, (2018).
Authors
Nathalie Opdam – van de Laar, Application Scientist II
Inge Thijssen – van Loosdregt, Staff Application Scientist
Axion BioSystems, Eindhoven, The Netherlands