異なる細胞株は、その増殖や形態変化パターンの差異により特徴づけられます。しかしながら、このような経時的な変化は、細胞密度、純度、培養環境など、細胞腫以外の要因にも影響されるため、その識別は容易ではありません。
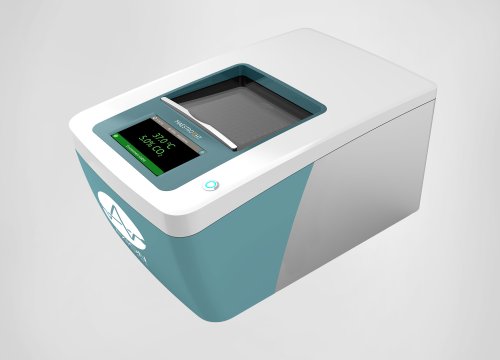
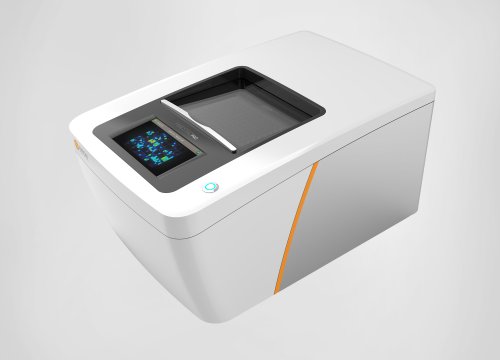
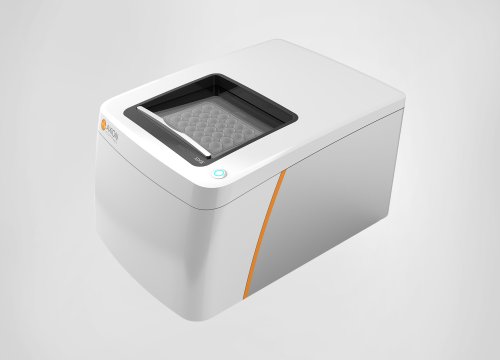
Axion BioSystems の Maestro では、インピーダンスの変化により、細胞の変化をラベルフリーで連続して、測定・解析することが可能です。数時間から数日間に渡る連続した測定は、エンドポイントアッセイのような繰り返しを要せず、一度の試験で細胞のカイネティクスや薬剤応答などに関するより多くの情報が得られます。
細胞の増殖をリアルタイムで追跡
細胞の成長、接着、相互作用は、その生物学的な機能によって異なり、それぞれの細胞を特徴づけます。Maestro によるインピーダンスアッセイで、細胞の変化を経時的に測定し、細胞の種類、密度、形態変化において識別が可能です。
このような細胞のプロファイリングは、細胞の品質や純度、生存率の定量化、アッセイタイミングの最適化などにも用いられますが、Maestro システムを用いて、これらの試験が簡単に行えます。細胞は温度・CO₂が正確に制御されたチャンバー内に設置され、数日間から数週間に渡り連続して細胞の増殖を追跡することができます。
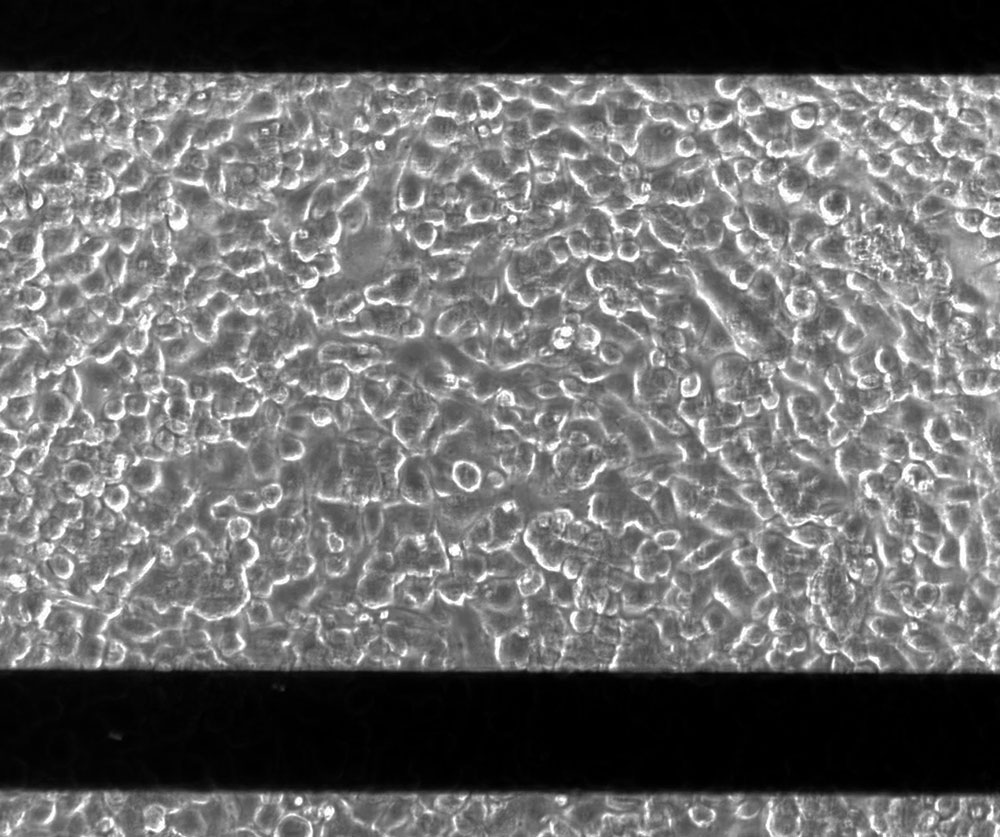
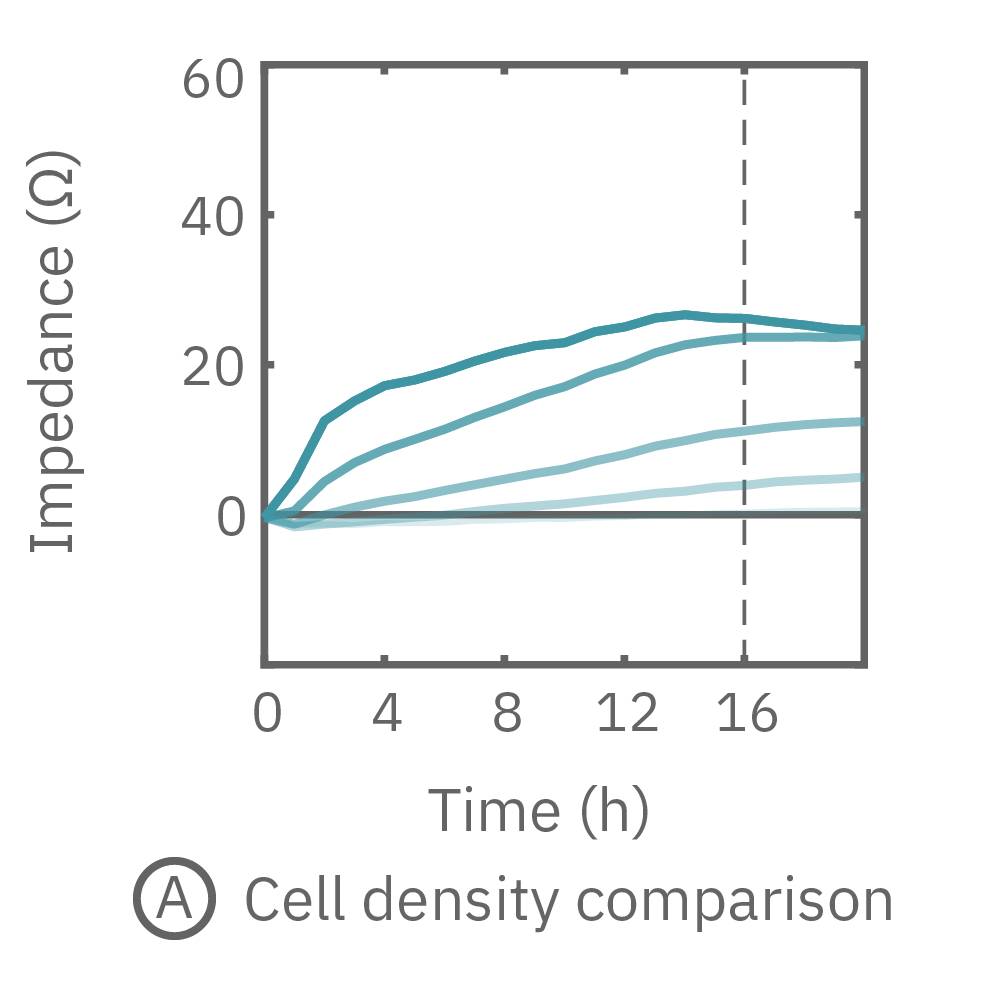
(A) CytoView-Z プレート上に HeLa 細胞を異なる密度条件で播種し、Maestro Zでインピーダンスを測定した。細胞の増殖に伴いインピーダンスが上昇した。
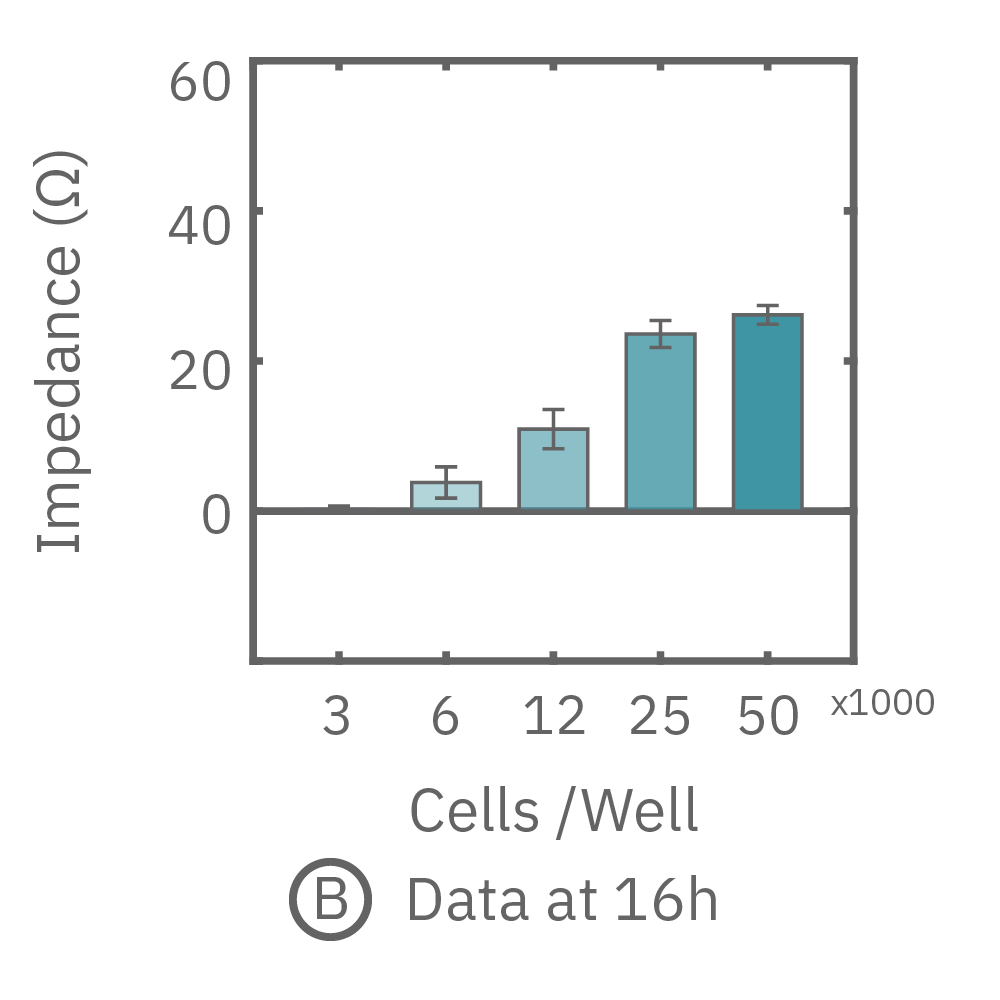
(B) 16時間後 (A図点線箇所)のインピーダンス値。高密度条件ほど高いインピーダンス値が得られた。
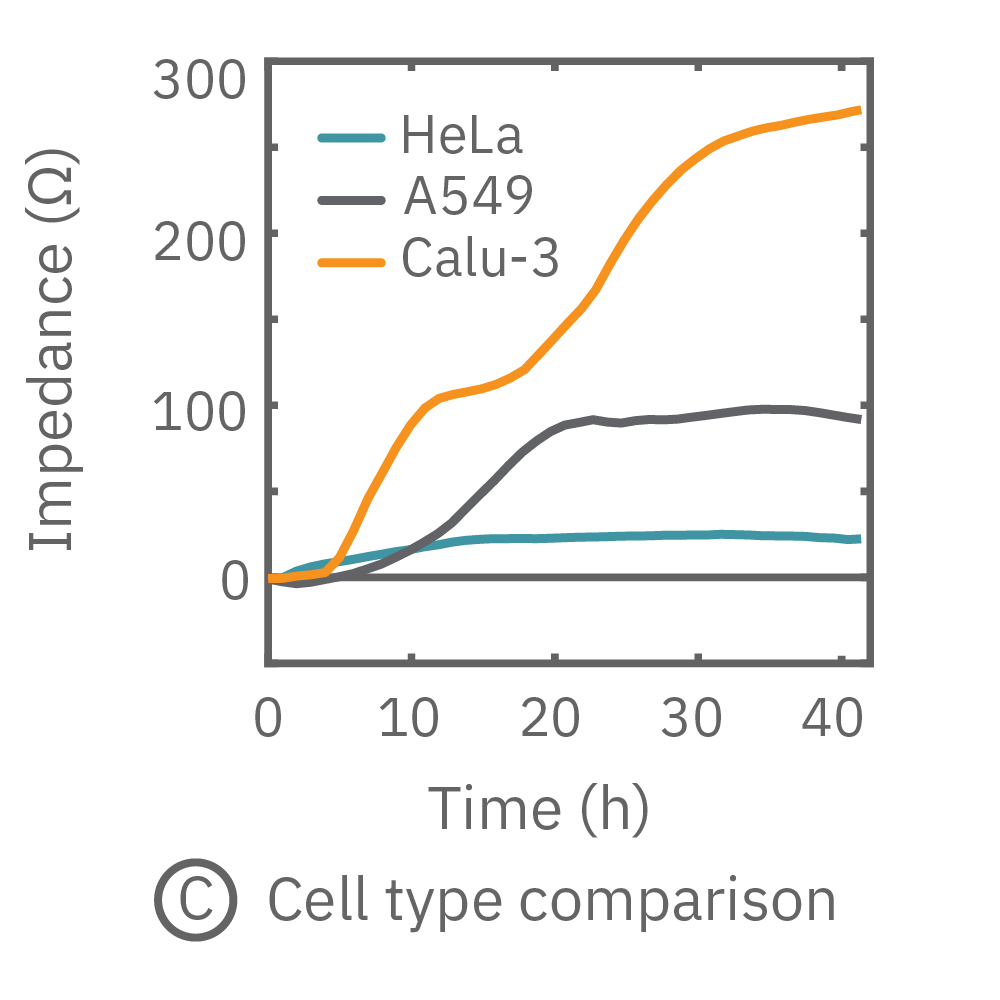
(C) HeLa (水色)、A549 (グレー色)、Calu-3 (オレンジ)細胞のインピーダンスを測定したところ、それぞれに異なる成長カーブが得られた。
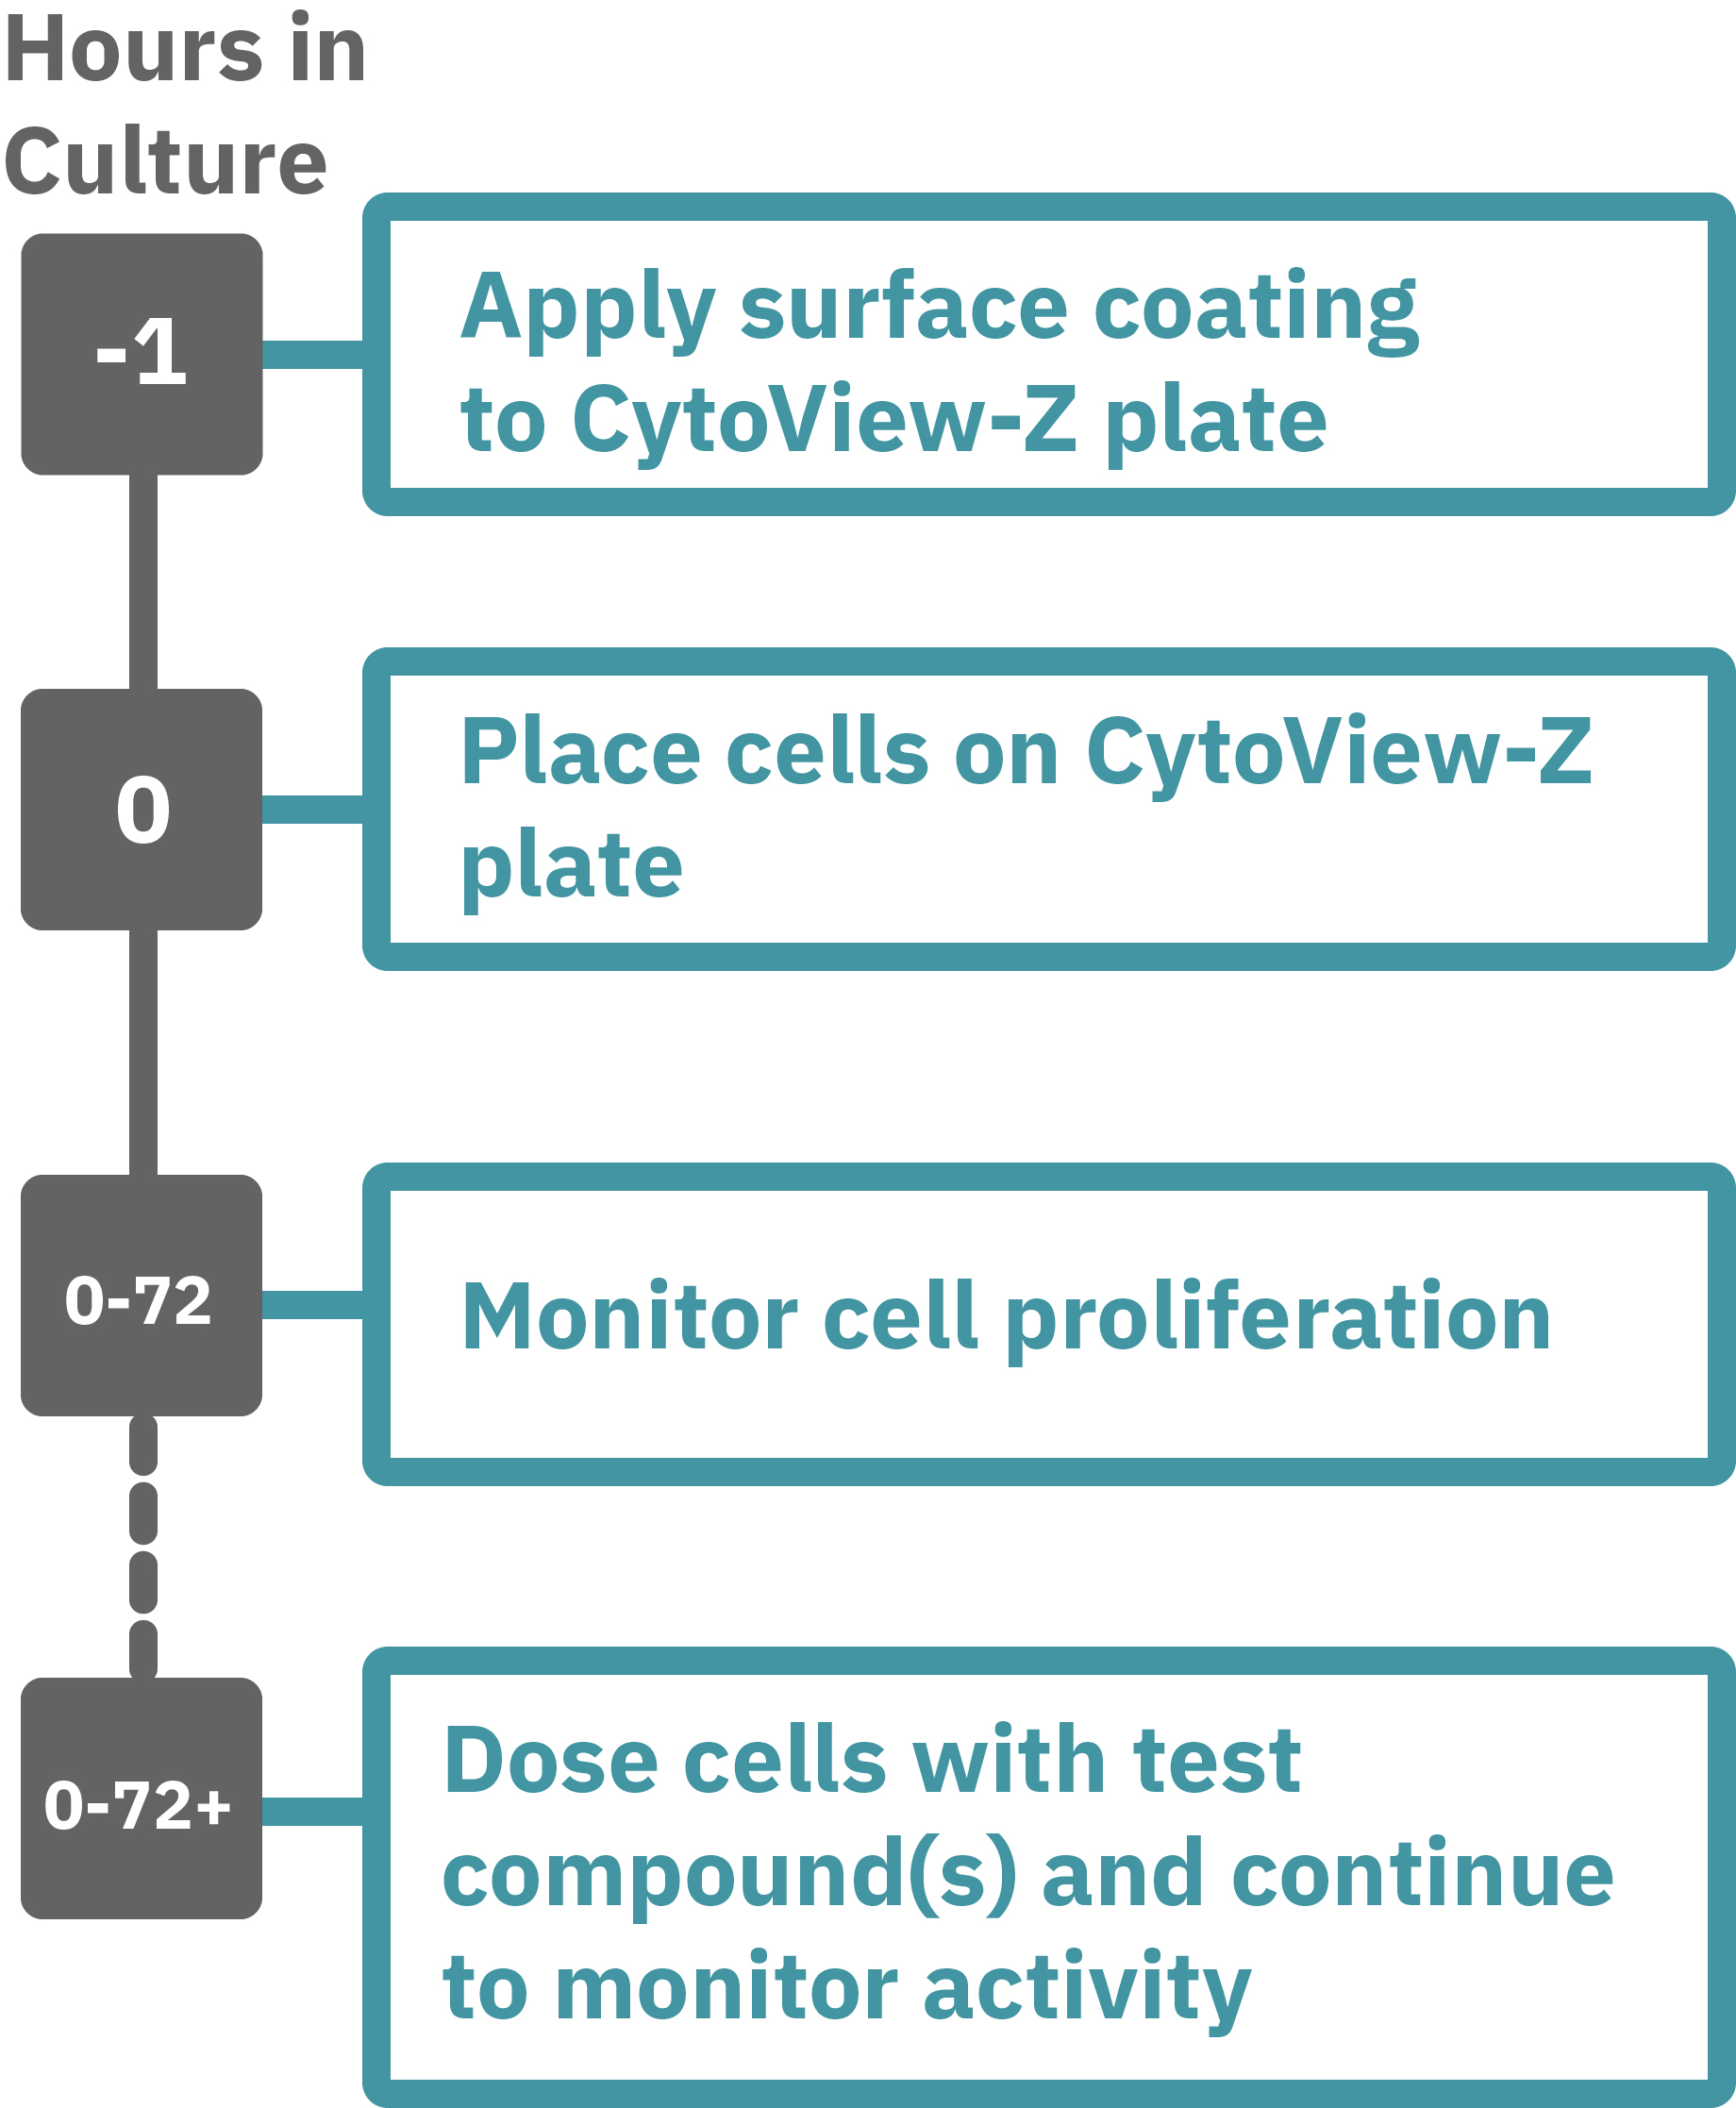
Maestroによる、インピーダンスアッセイはとても簡単です。事前コーティングされた CytoView-Z プレート上に細胞を播種します (Hour 0)。Maestroシステムにプレートを搭載するとと同時に、温度・CO₂ 濃度制御とインピーダンス測定が開始されます。細胞の増殖・電極への接着に伴いインピーダンスが上昇します (Hour 0 -72)。
細胞の変化はラベルフリーで測定され、リアルタイムにソフトウエア上に表示されます。測定終了後は付属のソフトで解析します。
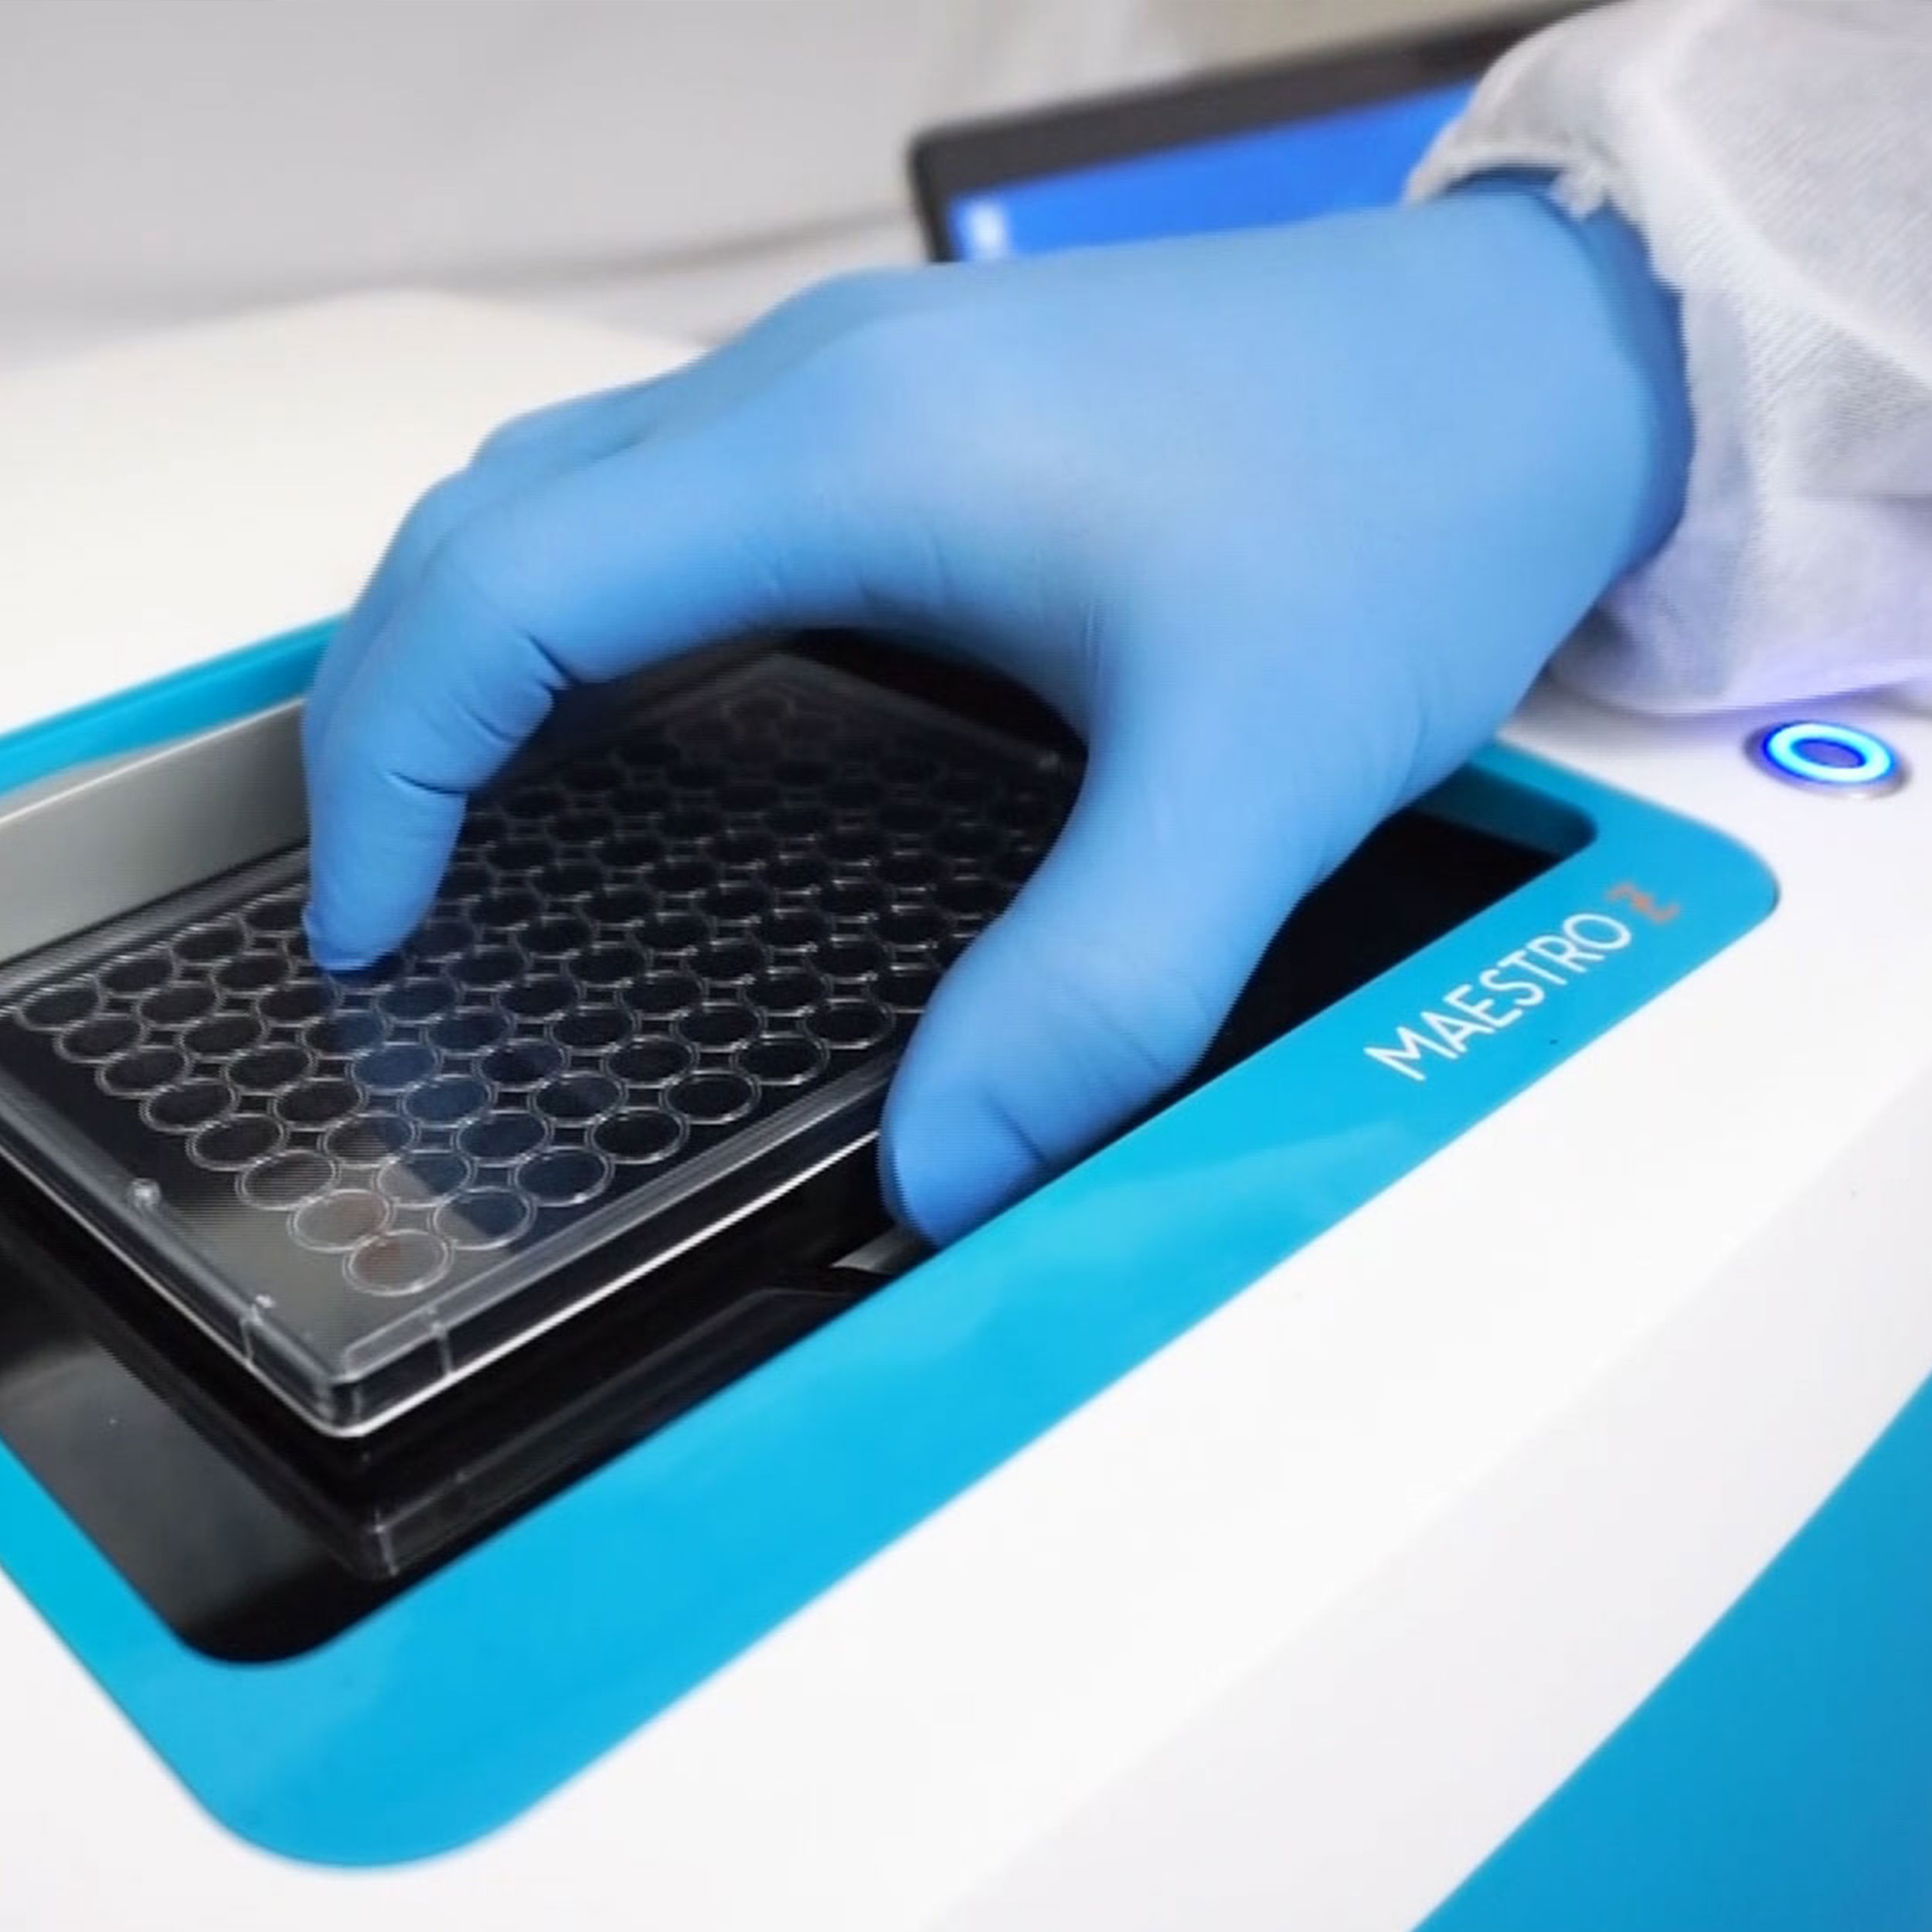
Maestro Z/ ZHT, Pro/Edgeによる細胞増殖アッセイ:特徴
-
経時的観察 - 96 或いは384 well 同時に細胞増殖を連続して測定します。専用アプリで、実験室の外からでもライブデータの確認が可能です。
-
ラベルフリー - 平面電極によるインピーダンス測定は、染色・試薬などを必要としません。ラベルフリー測定で数日間に渡る測定・観察が可能です。
-
インキュベータ不要 - Maestroには温度・CO2濃度コントローラが内蔵されています。インキュベータ等の周辺装置は不要。安定した環境下で数日間に渡る連続測定が可能です。
-
細胞可視 - CytoView-Z 96 well プレート底面中央部は透明になっています。必要に応じて、細胞の観察が可能です。
-
培養から測定まで同一プレート使用 - アッセイの全行程を同一プレートで行います。他のハイスループット・プラットフォーム(例:フローサイトメータ)のような容器の入れ替えなどは不要。細胞への負担を最小限に抑えることができます。
-
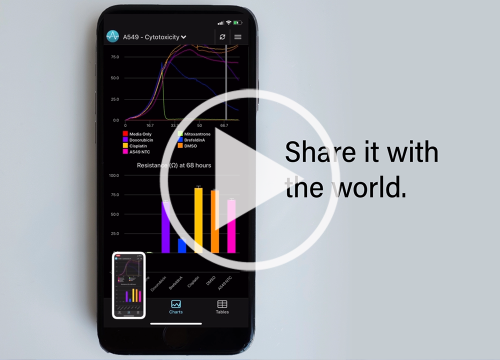
スマートフォン・アプリ - 専用のスマートフォンアプリに対応しています。数日間に渡る細胞増殖の様子を、実験室の外からでも、リアルタイムに観察して頂けます。
-
簡単 - セミ・オートメーションシステムです。ハードウエアの操作はボタン1つ。専用のソフトは、インピーダンスの変化をリアルタイムで表示します。解析結果のエクスポートも容易です。

Impedance
Show Full DetailsImpedance: For real-time cell analysis
Impedance-based cell analysis is a well-established technique for monitoring the presence, morphology, and behavior of cells in culture. Impedance describes the obstruction to alternating current flow. To measure impedance, small electrical currents are delivered to electrodes embedded in a cell culture substrate. The opposition to current flow from one electrode to another defines the impedance of the cell-electrode interface. When cells are present and attached to the substrate, they block these electrical currents and are detected as an increase in impedance.
Impedance is sensitive to many aspects of cell behavior: attachment, spreading, shape, cell-cell connections (e.g. tight junctions), and death. Even small transient changes, such as swelling or signaling, are detectable by impedance. Because impedance is noninvasive and label free, the dynamics of these changes can be monitored in real time over minutes, hours, or even days without disturbing the biology.
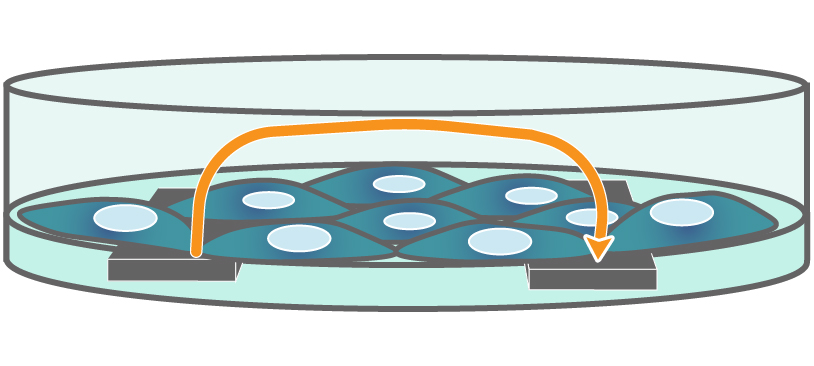
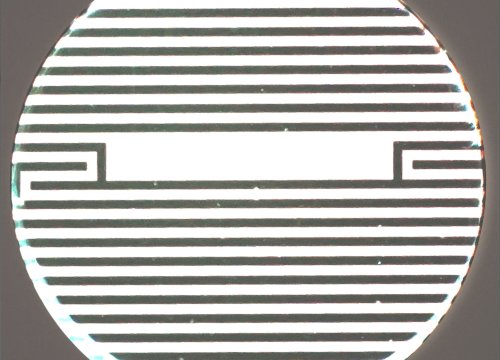
Interdigitated electrodes embedded in the cell culture substrate at the bottom of each well detect small changes in the impedance of current flow caused by cell presence, attachment, and behavior.
In the example below, the electrodes are initially uncovered before cells are added. The electrical current passes easily and the impedance is low. When cells begin to attach and cover the electrodes, less electrical current passes and the impedance is high. After dosing with a cytotoxic agent, cells die or detach, and the impedance decreases back towards baseline.
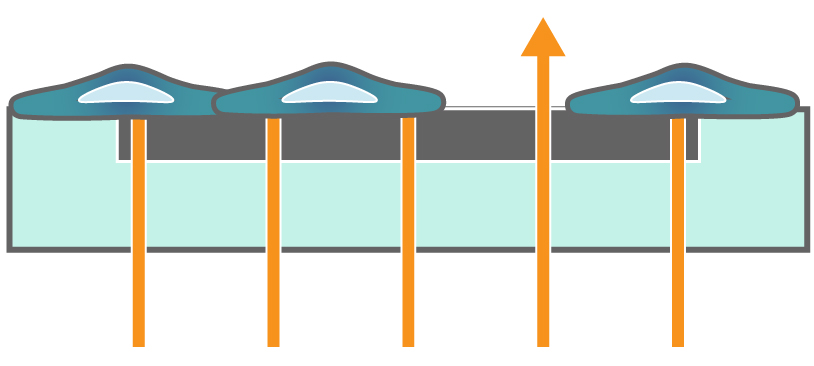
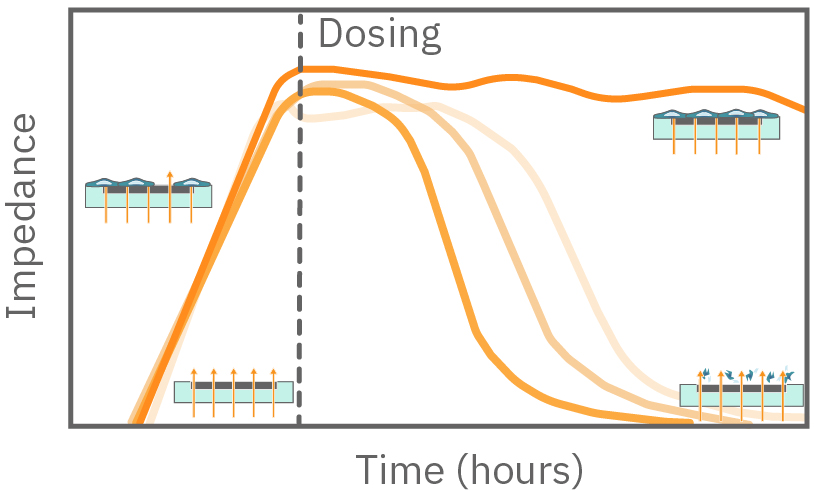
Impedance measures how much electrical signal (orange arrows) is blocked by the cell-electrode interface. Impedance increases as cells cover the electrode and decreases back to baseline due to cell death.
Continuous cell monitoring
Many cell-based assays are endpoint assays, limited to a single snapshot in time. Repeating these assays at multiple time points can be labor intensive, time consuming, and costly. Key time points can be easily missed. Impedance-based cell analysis is nondestructive and label free, meaning that cellular dynamics can be monitored continuously.
The impedance assay can be used to characterize dynamic cell profiles, revealing how cells grow, attach, and interact over time. Each cell type exhibits a different cell profile, or “fingerprint”, of dynamic cell behavior. These profiles are sensitive to cell type, density, purity, and environmental factors. In this example, the Maestro Z impedance assay readily distinguished cell profiles across different cell densities and cell types.
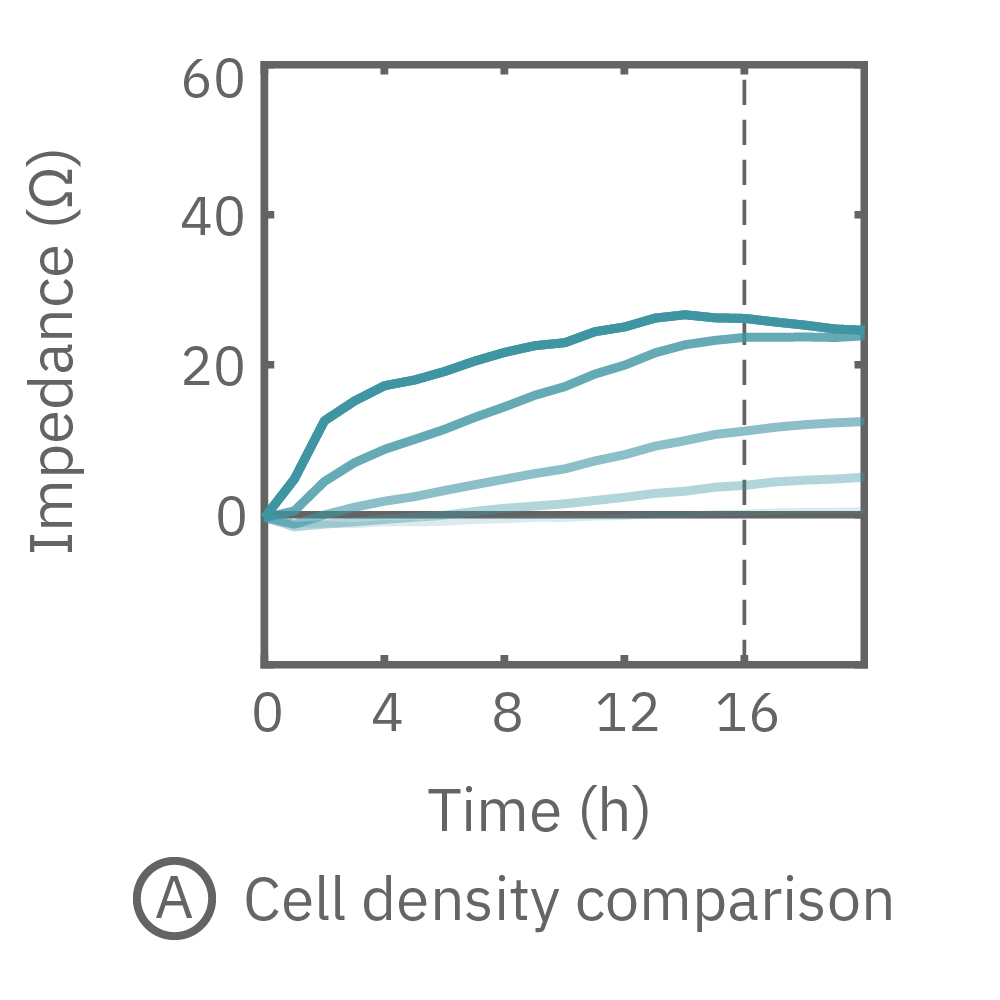
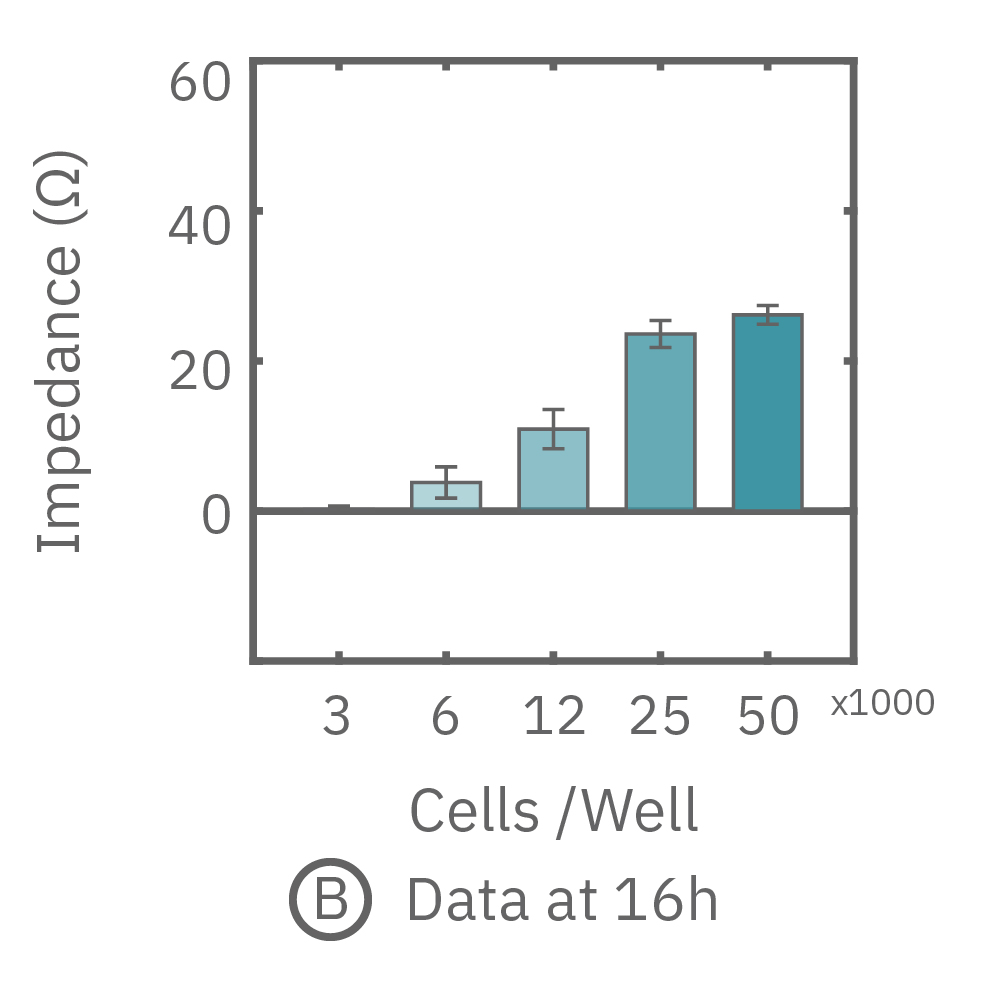
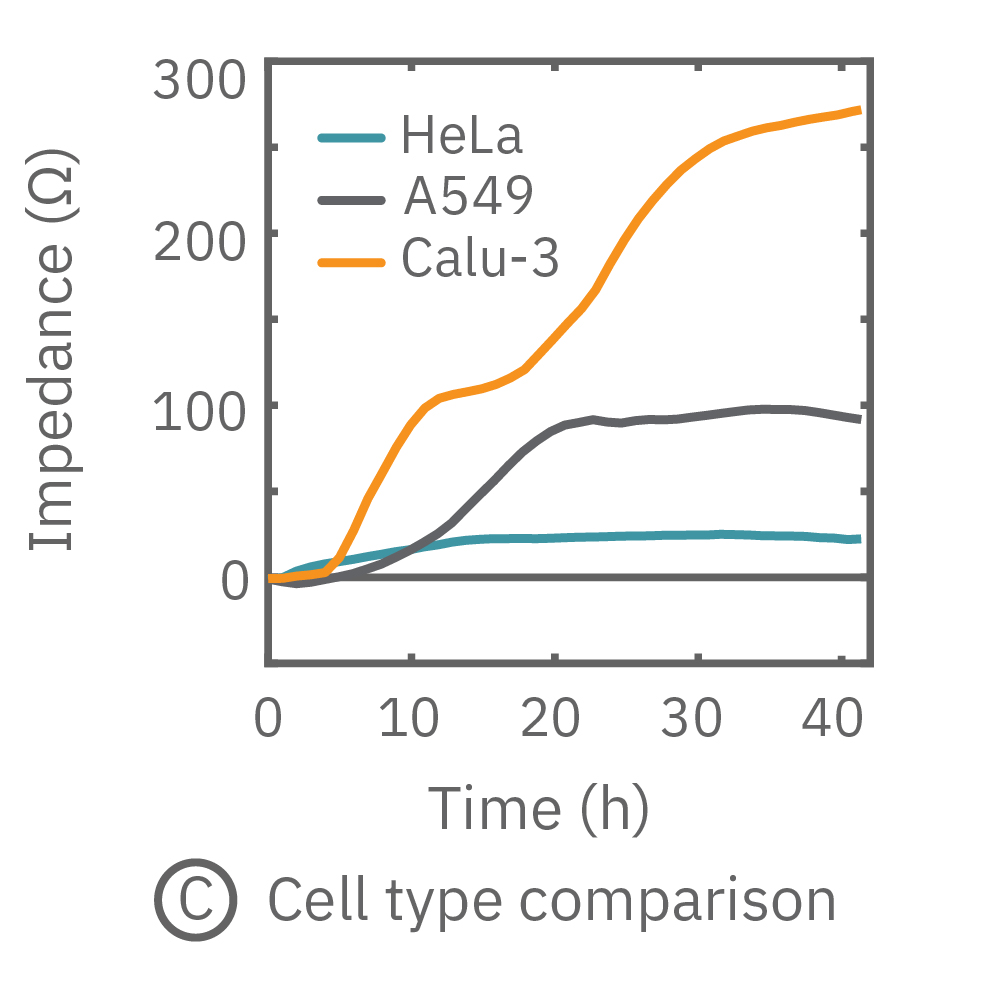
(A, B) HeLa cells were seeded on a CytoView-Z plate at varying densities and the impedance was continuously monitored by the Maestro Z. Impedance scaled proportionally with cell density and readily distinguished different densities of the same cell type. (C) Maestro monitored the growth of three cell types, HeLa, A549, and Calu-3, and readily distinguishes their distinct cell profiles over time.
The Maestro Z impedance assay can also be used to capture the kinetics of cell responses to drugs or immune cell therapies. The kinetics, which cannot be captured by endpoint assays, often provide key insights into the efficacy of novel therapies. In the example below, the Maestro Z impedance assay was used to quantify the kinetics of cytotoxicity of chemotherapy agents.
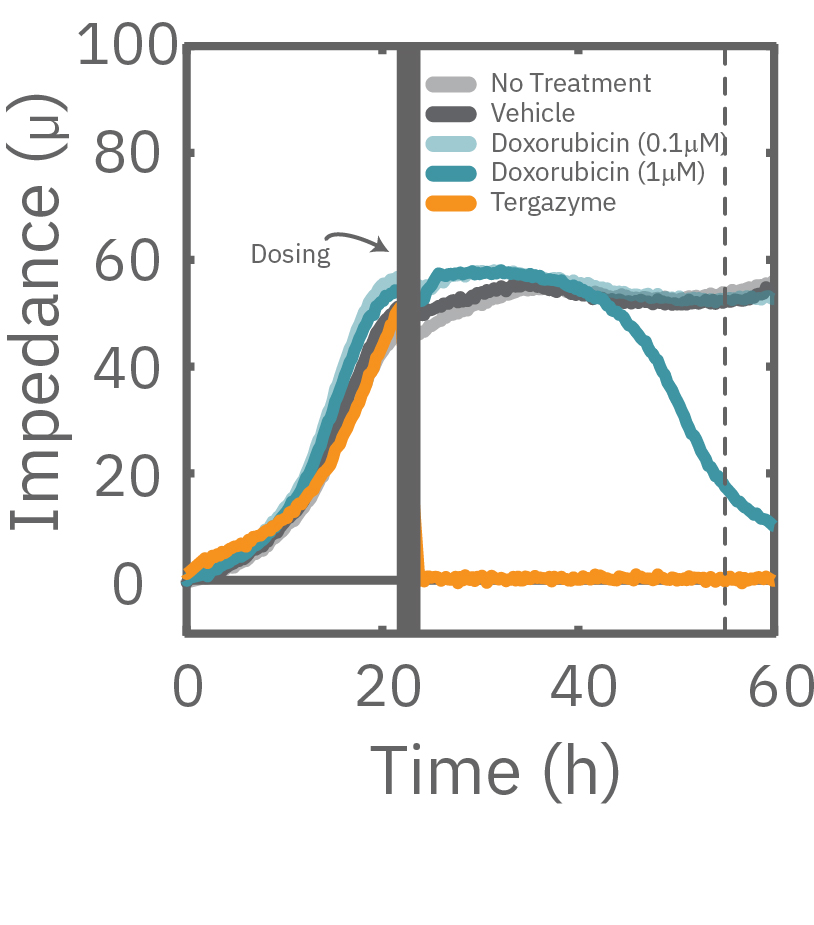
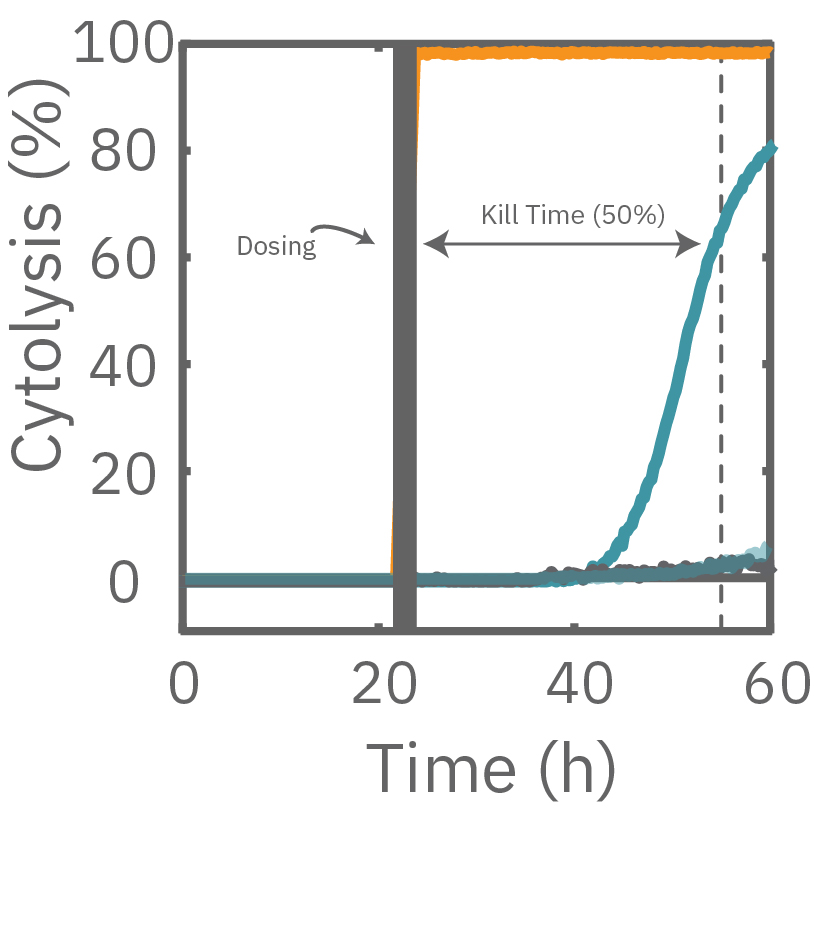
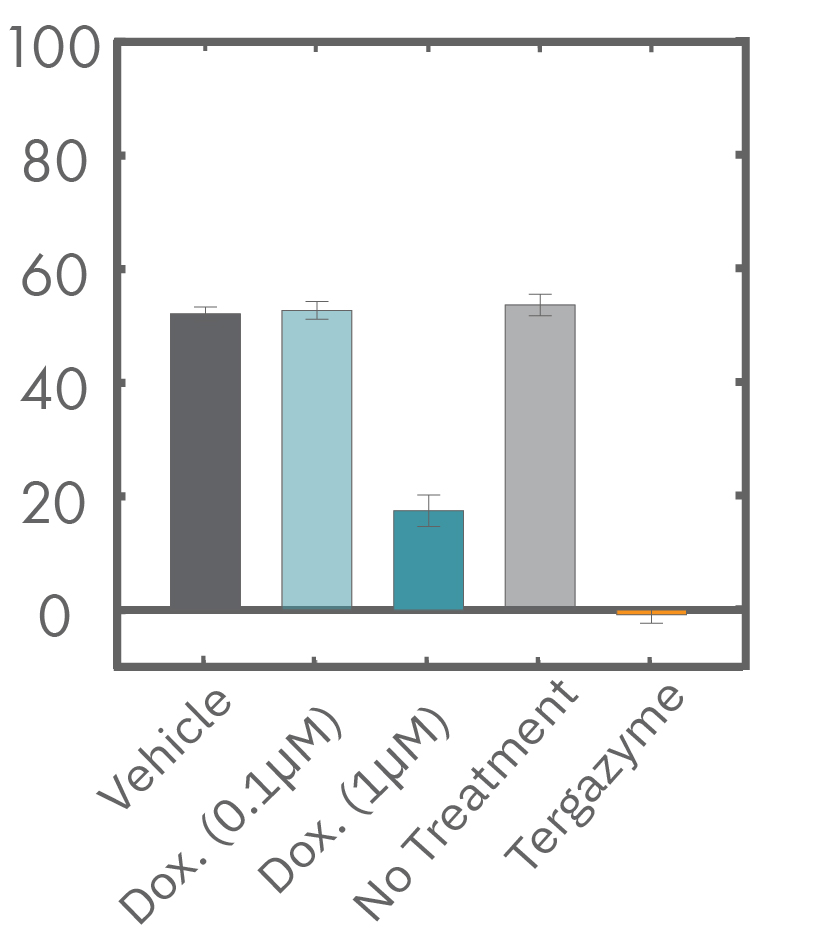
A549 cells were dosed with dox, vehicle (DMSO), or tergazyme. Wells dosed with tergazyme showed an immediate decrease in impedance, reflecting complete cell death. Higher doses of dox resulted in a slower decrease in impedance and cell death. Cells dosed with 1 μM dox reached 50% cytolysis at 31 hrs.
Different frequencies reveal cell properties
Impedance varies with frequency, such that different frequencies reveal different aspects of cell biology. The small currents used to measure impedance will always take the path of least resistance. At low frequencies, such as 1 kHz, the impedance of the cell membrane is relatively high, forcing the current to flow under and between the cells. Low frequencies provide details about barrier integrity, the presence of gap junctions, and transepithelial or transendothelial resistance (TEER).
At high frequencies, such as 41.5 kHz, the impedance (and capacitive reactance) of the cell membrane is relatively low. Thus, most of the current couples capacitively through the cell membranes, providing information about the cell layer such as confluency and coverage.
In other words, low frequencies are sensitive to “what” cells are there, whereas high frequencies are sensitive to “how many” cells are there. The Maestro Z impedance assay uses multiple frequencies to provide the most information about the cells, simultaneously, continuously, and in real time.
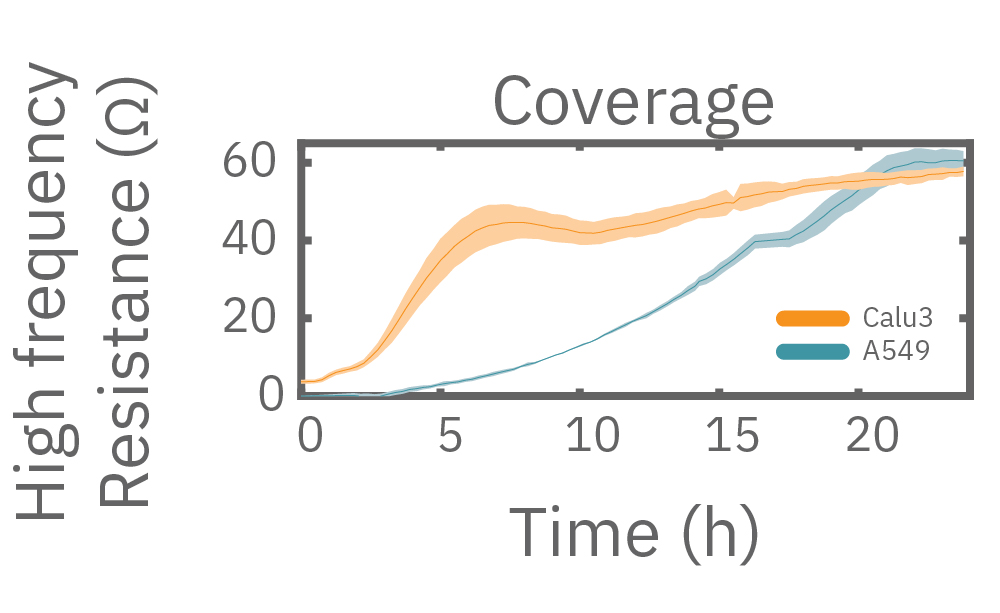
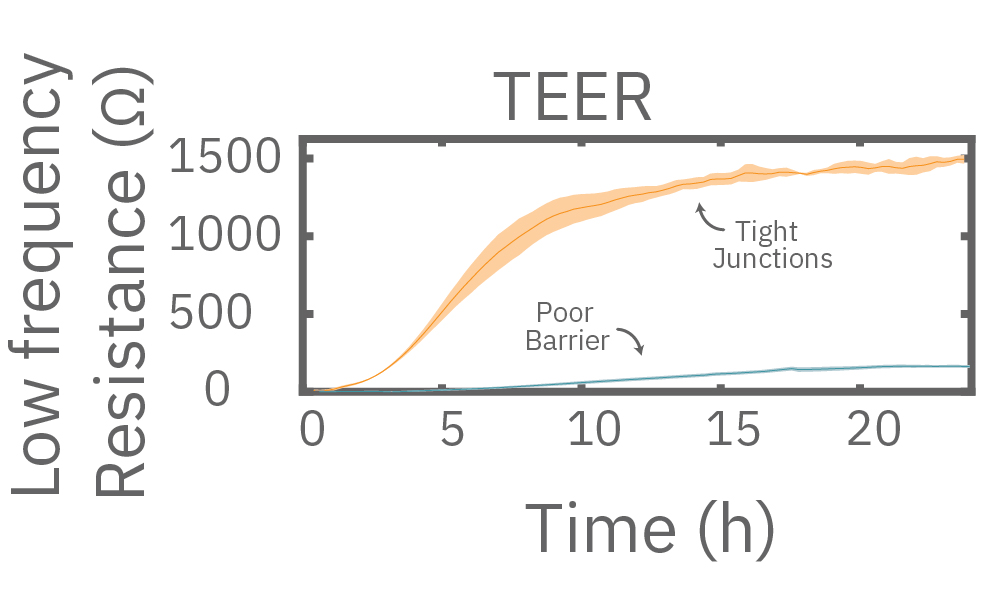
Multiple frequencies were used to simultaneously and continuously monitor the coverage and barrier function (TEER) of Calu-3 and A549 cells. Coverage, measured as resistance at 41.5 kHz, increases over time for both cell types. TEER, measured at 1 kHz, reveals that only Calu-3 cells form a strong barrier, as they express tight junctions to block flow between neighboring cells.
